Decile
Analysis Primer:
Cum Lift for Response Model
Bruce Ratner, Ph.D.
Cum Lift for Response Model
Bruce Ratner, Ph.D.
The decile analysis is
a tabular display of model performance. I illustrate the construction
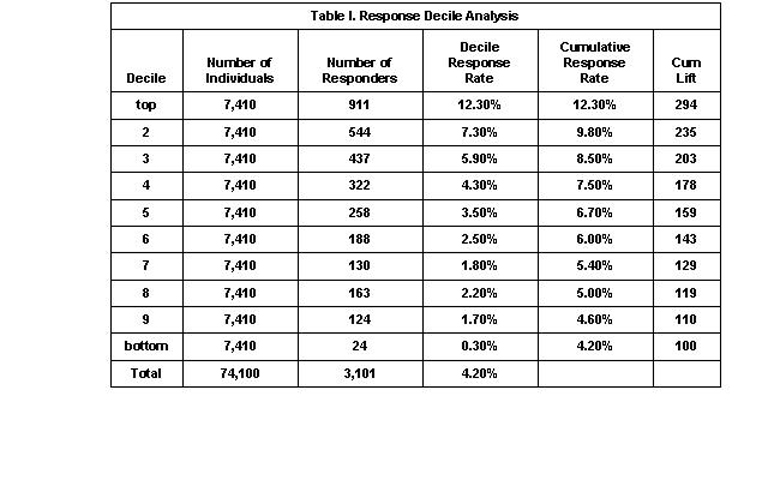
and interpretation of the response decile analysis in Table I. (The
response model, on which the decile analysis is based, is not shown.)
But, keep in mind that the decile analysis only indicates the
accuracy of a response model. There are two additional
concepts of model assessment - precision and separability - that are needed to complete
the picture of response model performance.
Construction of the Response Decile Analysis
1. Score the validation
sample or file using the response model under consideration. Every
individual receives a model score, Prob_est, the model's estimated
probability of response.
2. Rank the scored file, in descending order by Prob_est.
3. Divide the ranked
and scored file into ten equal groups. The Decile variable is
created, which takes on ten ordered 'values': top(1), 2, 3, 4, 5, 6, 7,
8, 9, and bottom(10). The 'top' decile consists of the best 10% of
individuals most-likely to respond; decile 2 consists of the next 10%
of individuals most-likely to respond. And so on, for the remaining
deciles. Accordingly, Decile separates and orders the individuals on an
ordinal scale ranging from most to least likely to respond.
4. Number of Individuals is the number of individuals in each decile; 10% of the total size of the file.
5. Number of
Responses (actual) is the actual - not predicted - number of
responses in each decile. The model identifies 911 actual responders in
the top decile. In decile 2, the model identifies 544 actual
responders. And so on, for the remaining deciles.
6. Decile Response
Rate is the actual response rate for each decile group. It is Number
of Responses divided by Number of Individuals for each
decile group. For the top decile, the response rate is 12.3% (=
911/7,410). For the second decile, the response rate is 7.3%
(=544/7,410). Similarly for the remaining deciles.
7. Cumulative
Response Rate for a given depth-of-file (the aggregated or
cumulative deciles) is the response rate among the individuals in the
cumulative deciles. For example, the cumulative response rate for the
top decile (10% depth-of-file) is 12.3% (=911/7,410). For the top two
deciles (20% depth-of-file), the cumulative response rate is 9.8% = (
[911+544]/[7410+7410] ). Similarly for the remaining deciles.
8. Cum Lift -
for a given depth-of-file - is the Cumulative Response Rate
divided by the overall response rate of the file, multiplied by 100. It
measures how much better one can expect to do with the model than
without a model. For example, a Cum Lift of 294 for the top decile
means that when soliciting to the top 10% of the file based on the
model, one can expect 2.94 times the total number of responders found
by randomly soliciting 10%-of-file. The Cum Lift of 235 for top two
deciles, means that when soliciting to 20% of the file based on the
model, one can expect 2.35 times the total number of responders found
by soliciting 20%-of-file without a model. Similarly for the remaining
deciles. (My SAS-code program is available upon request: click here .)
Rule: The larger the Cum Lift value the better the accuracy, for a given depth-of-file.

Go back to article Maximizing the Lift in Database Marketing.
1 800 DM STAT-1, or e-mail at br@dmstat1.com.