
| Live chat by Boldchat |
A
Phat Example of the GenIQ Model's Predictive Power
Bruce Ratner, Ph.D.
Outline of Article
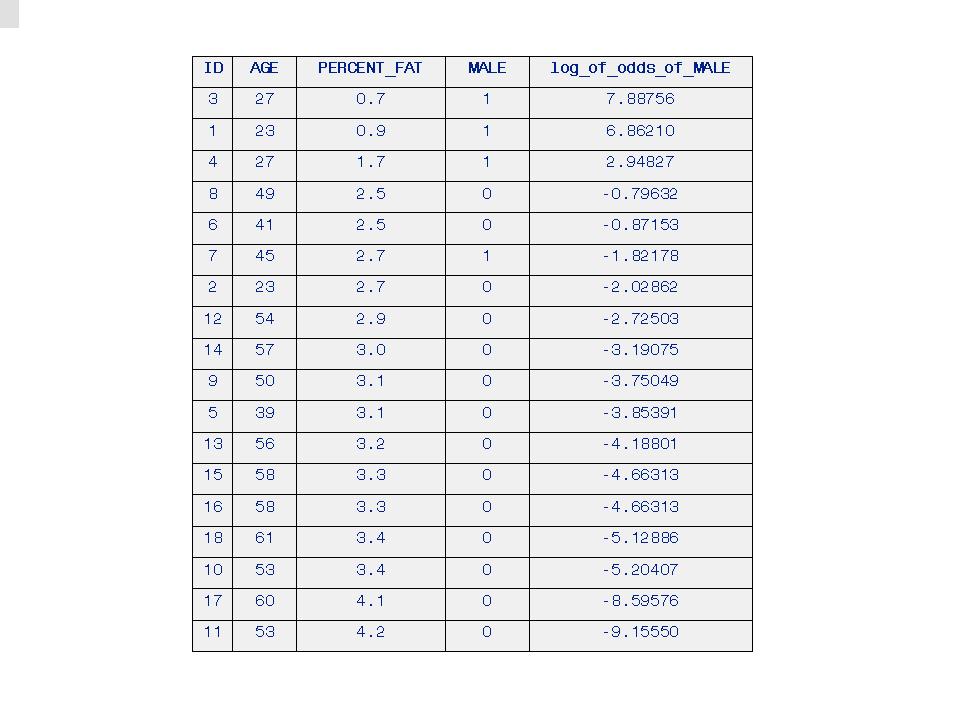
The GenIQ Model (Tree Display)

x1 = PERCENT_FAT;
x1 = Int(x1);
x2 = AGE;
x3 = PERCENT_FAT;
x3 = Int(x3);
x4 = .1407257;
x5 = AGE;
x4 = x4 * x5;
x4 = Int(x4);
x3 = x3 * x4;
If x2 NE 0 Then x2 = x3 / x2; Else x2 = 1;
x1 = x2 - x1;
GenIQvar = x1;
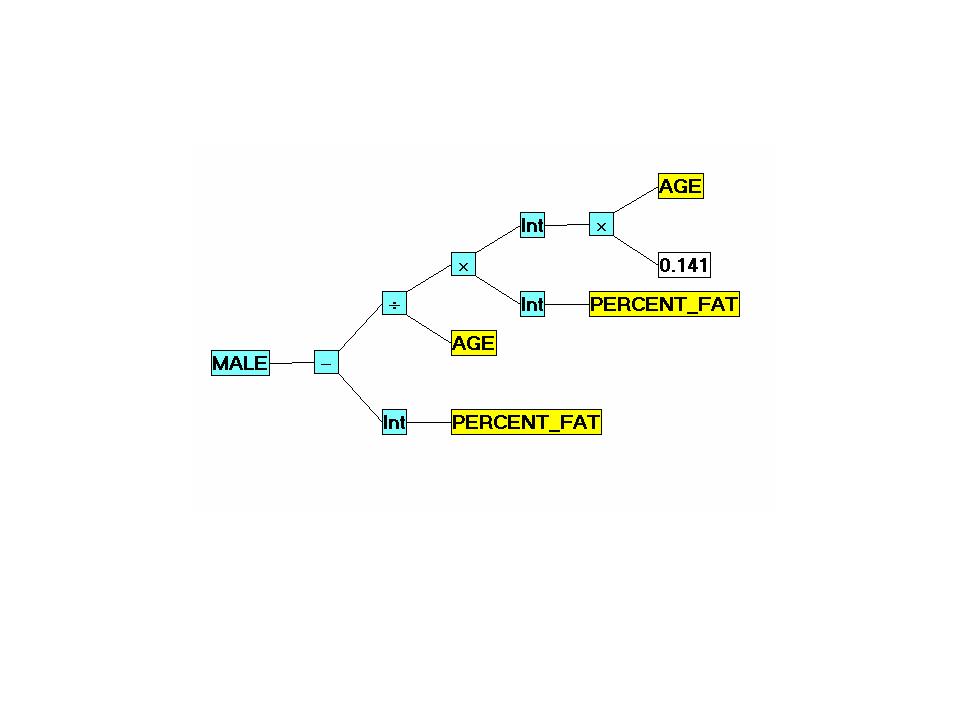
Table7. GenIQ Model Version #2 GenIQvar2 Rank-order Prediction of MALE

IX.Summary
The machine learning paradigm (MLP) “let the data suggest the model” is a practical alternative to the statistical paradigm “fit the data to the equation,” which has its roots when data were only “small.” It was – and still is – reasonable to fit small data in a rigid parametric, assumption-filled model. However, the current information (big data) in, say, cyberspace requires a paradigm shift. MLP is a utile approach for database modeling when dealing with big data, as big data can be difficult to fit in a specified model. Thus, MLP can function alongside the regnant statistical approach when the data – big or small – simply do not “fit.” As demonstrated with the “Phat Example” data, MLP works well within small data settings.
For an eye-opening preview of the 9-step modeling process of GenIQ, click here.
Go to Articles page.
Bruce Ratner, Ph.D.
The purpose of this
article is to exemplify, or more to the point swank the predictive
power of the GenIQ Model© – an alternative technique for
modeling a binary or continuous target variable. The GenIQ
Model©, which is based on the assumption-free, nonparametric
genetic paradigm inspired by Darwin’s Principle of Survival of the
Fittest, offers theoretical and ease-of-use advantages over the
standard logistic and ordinary least-squares regression models. It
automatically and simultaneously “evolves” the model structure, and the
variable selection among candidate predictor variables. The open-worked
GenIQ Model and its wordbook are both generally regarded as not
demanding on newcomers of genetic modeling. A real case study
using human age and fatness, let's call it the "Phat Example," is
illustrated to encourage the use of the new method.
I use the machine learning GenIQ Model to build a classification model, which predicts the rank-order likelihood of being a male, to illustrate the advantages, and to highlight the singular weakness of the machine learning paradigm. Specifically, the GenIQ Model shows the superiority of the machine learning paradigm over the statistical paradigm, as it not only specifies the close-to-true model form (a computer program), but simultaneously performs variable selection (which in this example is trivial because only two predictor variables are considered), performs data mining and builds the model – it’s like a Genetic Jackknife 3-in-1 Method. The difficulty in interpreting the computer program often accounts for the limited use of the machine learning paradigm. (For FAQs about GenIQ, click here.)
I use the machine learning GenIQ Model to build a classification model, which predicts the rank-order likelihood of being a male, to illustrate the advantages, and to highlight the singular weakness of the machine learning paradigm. Specifically, the GenIQ Model shows the superiority of the machine learning paradigm over the statistical paradigm, as it not only specifies the close-to-true model form (a computer program), but simultaneously performs variable selection (which in this example is trivial because only two predictor variables are considered), performs data mining and builds the model – it’s like a Genetic Jackknife 3-in-1 Method. The difficulty in interpreting the computer program often accounts for the limited use of the machine learning paradigm. (For FAQs about GenIQ, click here.)
Outline of Article
I. Situation
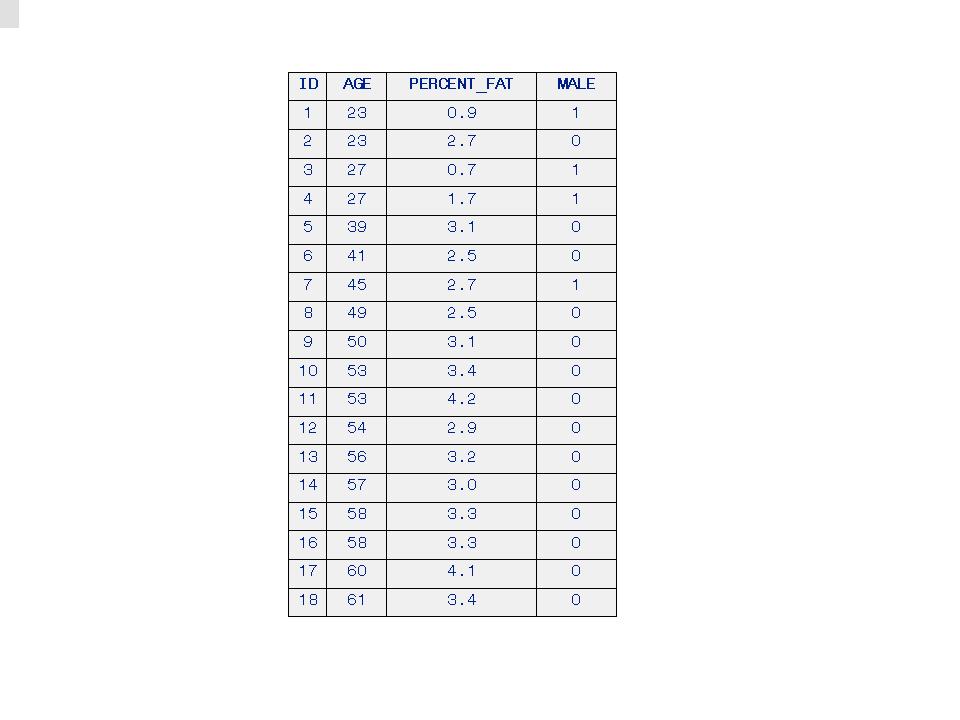
The data come from a
study investigating a new method of measuring body composition, and
give the body fat percentage (PERCENT_FAT), AGE, and gender (if
male then MALE=1, if female then MALE=0) for eighteen normal
adults aged between 23 and 61 years. How are AGE and PERCENT_FAT
related, and is there any evidence that the relationship is different
for males and females? Effectively, if a model that can distinguish
between males and females can be built then the model is
the evidence. The “Phat Example" data are in
Table 1, below (from American Journal of Clinical Nutrition, 40,
834-839).
Table 1. The “Phat Example" Data
Table 1. The “Phat Example" Data

I built the
easy-to-interpret logistic regression model (LRM), and the
not-so-easy-to-interpret GenIQ Model for the target variable MALE. This
creates a counterpoint where the data analyst now can choose between a
good interpretable model and a potentially better,
unexplainable model.
II. LRM Output
The LRM output (Analysis of Maximum Likelihood Estimates) - arguably the best Phat-LRM equation (model) is:
III. Phat-LRM Results
II. LRM Output
The LRM output (Analysis of Maximum Likelihood Estimates) - arguably the best Phat-LRM equation (model) is:
Log of odds of MALE(=1)
= 11.0912 + 0.00940*AGE - 4.9393*PERCENT_FAT
III. Phat-LRM Results
The results of the
Phat-LRM are in Table 2. LRM log_of_odds_of_MALE-Rank-order Prediction
of MALE, below. There is not a perfect rank-order prediction of MALE
for adult ID #7, as he is in the sixth rank, not the fourth rank, which
would make the Phat-LRM results perfect.
Table
2. Rank-order Prediction of MALE based on log_of_odds_of_MALE

IV. GenIQ Model Output
The Phat-GenIQ Model Tree Display and its Form (Computer Program) are below.
The Phat-GenIQ Model Tree Display and its Form (Computer Program) are below.
The GenIQ Model (Tree Display)

The
GenIQ Model (Computer Program)
x1 =
PERCENT_FAT;
x2 = AGE;
x2 = Sin(x2);
x1 = x2 - x1;
GenIQvar = x1;
x2 = AGE;
x2 = Sin(x2);
x1 = x2 - x1;
GenIQvar = x1;
V. GenIQ Variable
Selection
GenIQ variable
selection provides a rank-ordering of variable importance for a
predictor variable with respect to other predictor variables considered
jointly. This is in stark contrast to the well-known, always-used
statistical correlation coefficient, which only provides a simple
correlation between a predictor variable and the target variable -
independent of the other predictor variables under consideration.
Because this study only has two predictor variables the rank-ordering
of variable importance is trivial.
Variable Importance
(w/r/to other variables considered jointly)
1. PERCENT_FAT
2. AGE
1. PERCENT_FAT
2. AGE
VI. GenIQ Data Mining
GenIQ data mining is
directly apparent from the GenIQ tree itself. Because this study
only has two predictor variables, there are no signature GenIQ
branches (genetically data-mined structure, i.e., new variables -
the "golden nuggets" desired from a data mining effort), only
a sine transformation of AGE, sin(AGE), denoted by sine_of_AGE, which
actually is representative of data mining, albeit, the simplest
form.
To appreciate the predictive power of the GenIQ Model it is enlightening to see the single relationships for each predictor variable with the target variable, in Tables 3, 4 and 5, which show the Rank-order Predictions of MALE based on AGE, on sine_of_AGE, and on PERCENT_FAT, respectively.. Then, image the brilliance of the built-in IQ of GenIQ, in how it uncovers and ties together the individual data-mined relationships into its final model output in Section IV (GenIQ Model Tree Display and Computer Program) above, and in the GenIQ Model Results in Table 6 below.
Table 3. Rank-order Prediction of MALE based on AGE
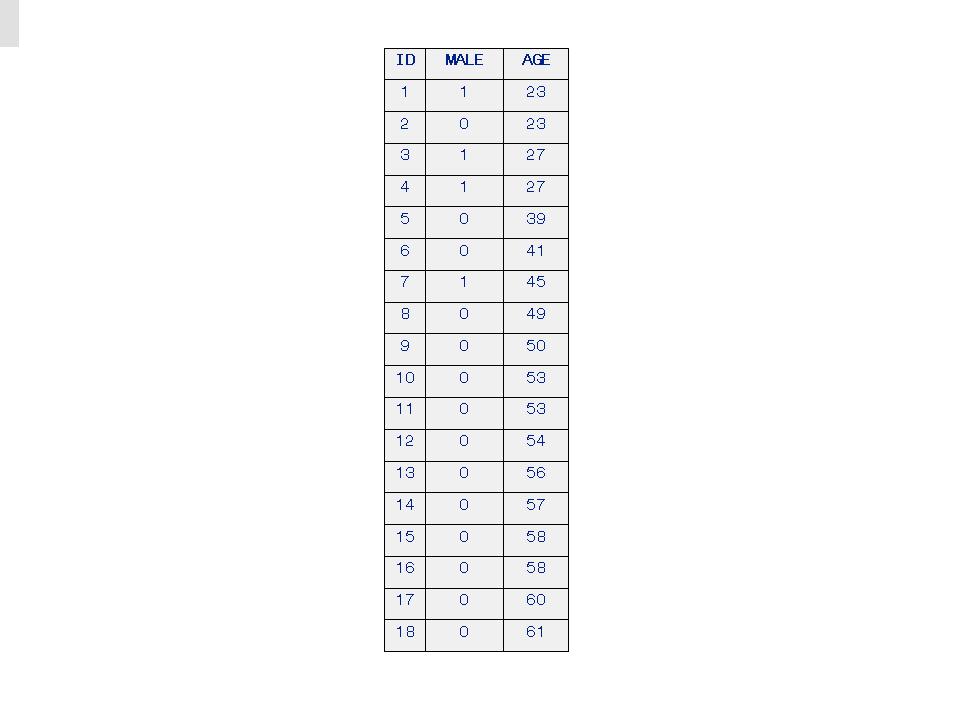
Table 4. Rank-order Prediction of MALE based on sine_of_AGE
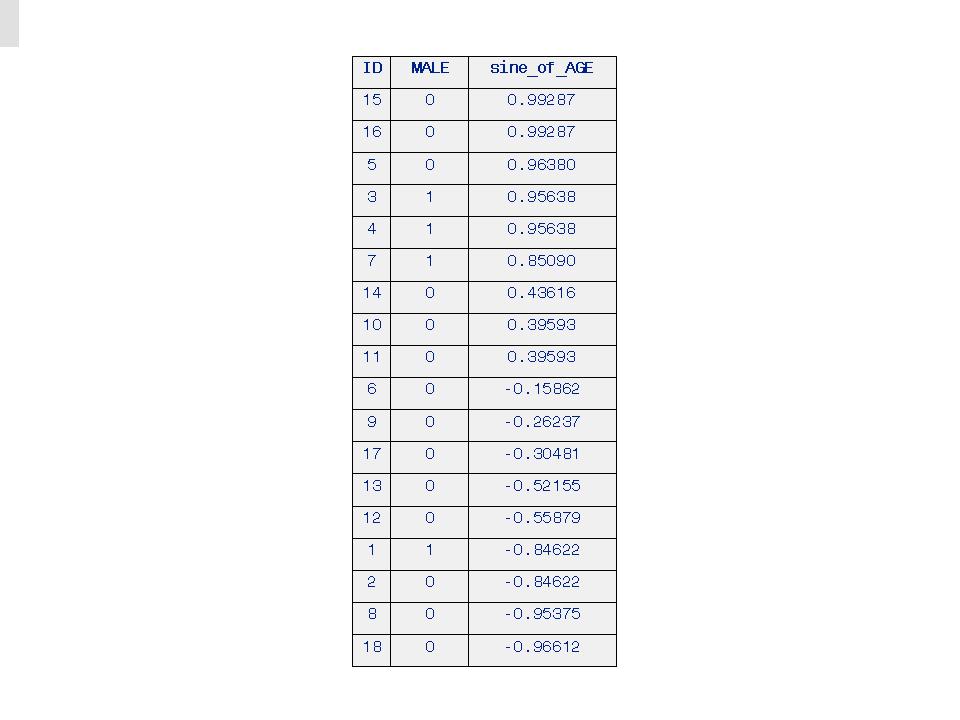
Table 5. Rank-order Predictions of MALE based on PERCENT_FAT

VII. Phat-GenIQ Model Results
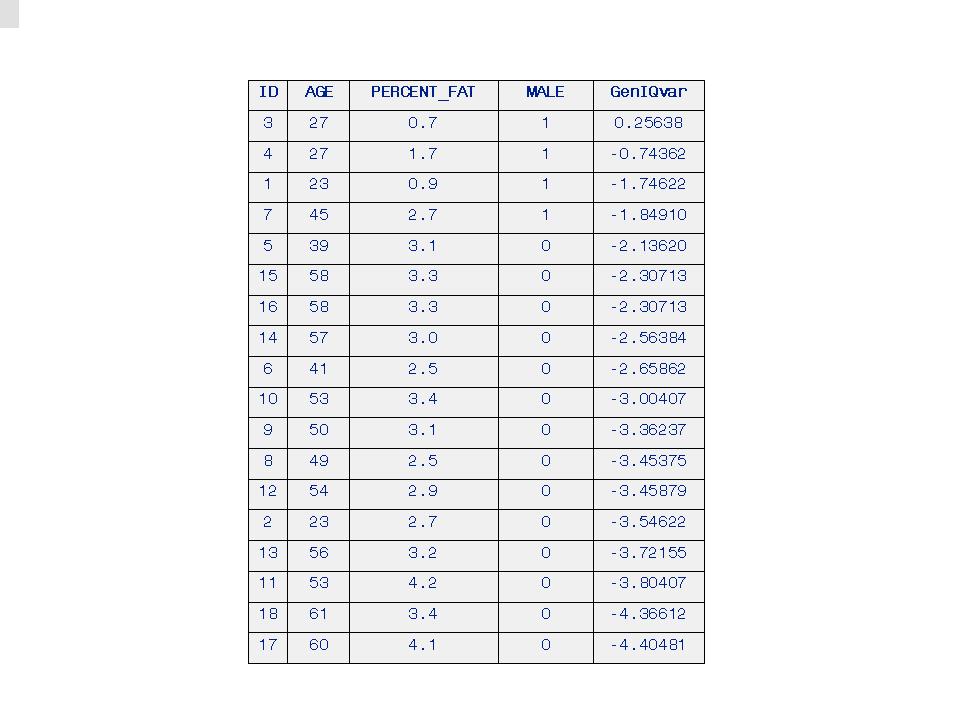
The results of the Phat-GenIQ Model are in Table 6. GenIQ Model GenIQvar Rank-order Prediction of MALE, below. There is a perfect rank-order prediction of MALE.
Table 6. GenIQ Model GenIQvar Rank-order Prediction of MALE
VIII. Phat-GenIQ Model Version #2 Output and Results
GenIQ modeling is like all other (non-physical science) modeling: there is no unique model, but there are comparable, if not exact, results from alternative methods or different versions of the modeling process. To that end, I built a Phat-GenIQ Model Version #2. The Phat-GenIQ Model Version #2 Tree Display and Computer Program (which includes Int, the Integer function that takes the integer part of the number at hand), and its corresponding Table 7. GenIQ Model Version #2 GenIQvar2 Rank-order Prediction of MALE, below. GenIQ Model Version #2 produces a perfect rank-order prediction of MALE.
However, I prefer the first Phat-GenIQ Model over the version #2 model because the first model is compact (a desirable property of any model), and more precise model scores (obviously a desirable property of any model) than the second model. The first model is compact, albeit at the expense of the unexpected appearance of the sine function. Also, its model scores for the top two adult ID's #3 and #4 have precisely distinguishing GenIQvar score values, 0.25638, and -0.74362, respectively. The Phat-GenIQ Model Version #2 is definitely not easy on the eyes (not compact), although it uses the easy-to-understand Integer function. But, it is not as precise as the first model, as it assigns the same GenIQvar2 score value of 0.00000 for the top two adult ID's #3 and #1.
The less precise Phat-GenIQ Model Version #2 readies an inquiry of whether the model is also less precise or discriminating vis-a-vis the first Phat-GenIQ Model among the females (MALE=0). This can be addressed by the Coefficient of Variation (CV). (Recall, the CV is a dimensionless number that allows comparison of the variation of populations with different positive mean values. It is often reported as a percentage by multiplying the above calculation by 100. The smaller the CV number, the less variation among the population/sample values.) It is often reported as a percentage by multiplying the above calculation by 100.) I use the CV to see if the variation - as an indicator of spread or diversity of model scores - is less for the second model than it is for the first model. I disregard the negative sign of the model scores to have positive mean values. The CVs are 22.97 and 23.08 for the GenIQvar2 and GenIQvar scores, respectively. Thus,
Phat-GenIQ Model Version #2 is not as precise as Phat-GenIQ Model to severalize the adult females.
As a counterpoint to analysis and modeling tasks in the non-physical science, consider:
To appreciate the predictive power of the GenIQ Model it is enlightening to see the single relationships for each predictor variable with the target variable, in Tables 3, 4 and 5, which show the Rank-order Predictions of MALE based on AGE, on sine_of_AGE, and on PERCENT_FAT, respectively.. Then, image the brilliance of the built-in IQ of GenIQ, in how it uncovers and ties together the individual data-mined relationships into its final model output in Section IV (GenIQ Model Tree Display and Computer Program) above, and in the GenIQ Model Results in Table 6 below.
Table 3. Rank-order Prediction of MALE based on AGE

Table 4. Rank-order Prediction of MALE based on sine_of_AGE

Table 5. Rank-order Predictions of MALE based on PERCENT_FAT

VII. Phat-GenIQ Model Results
The results of the Phat-GenIQ Model are in Table 6. GenIQ Model GenIQvar Rank-order Prediction of MALE, below. There is a perfect rank-order prediction of MALE.
Table 6. GenIQ Model GenIQvar Rank-order Prediction of MALE

VIII. Phat-GenIQ Model Version #2 Output and Results
GenIQ modeling is like all other (non-physical science) modeling: there is no unique model, but there are comparable, if not exact, results from alternative methods or different versions of the modeling process. To that end, I built a Phat-GenIQ Model Version #2. The Phat-GenIQ Model Version #2 Tree Display and Computer Program (which includes Int, the Integer function that takes the integer part of the number at hand), and its corresponding Table 7. GenIQ Model Version #2 GenIQvar2 Rank-order Prediction of MALE, below. GenIQ Model Version #2 produces a perfect rank-order prediction of MALE.
However, I prefer the first Phat-GenIQ Model over the version #2 model because the first model is compact (a desirable property of any model), and more precise model scores (obviously a desirable property of any model) than the second model. The first model is compact, albeit at the expense of the unexpected appearance of the sine function. Also, its model scores for the top two adult ID's #3 and #4 have precisely distinguishing GenIQvar score values, 0.25638, and -0.74362, respectively. The Phat-GenIQ Model Version #2 is definitely not easy on the eyes (not compact), although it uses the easy-to-understand Integer function. But, it is not as precise as the first model, as it assigns the same GenIQvar2 score value of 0.00000 for the top two adult ID's #3 and #1.
The less precise Phat-GenIQ Model Version #2 readies an inquiry of whether the model is also less precise or discriminating vis-a-vis the first Phat-GenIQ Model among the females (MALE=0). This can be addressed by the Coefficient of Variation (CV). (Recall, the CV is a dimensionless number that allows comparison of the variation of populations with different positive mean values. It is often reported as a percentage by multiplying the above calculation by 100. The smaller the CV number, the less variation among the population/sample values.) It is often reported as a percentage by multiplying the above calculation by 100.) I use the CV to see if the variation - as an indicator of spread or diversity of model scores - is less for the second model than it is for the first model. I disregard the negative sign of the model scores to have positive mean values. The CVs are 22.97 and 23.08 for the GenIQvar2 and GenIQvar scores, respectively. Thus,
Phat-GenIQ Model Version #2 is not as precise as Phat-GenIQ Model to severalize the adult females.
As a counterpoint to analysis and modeling tasks in the non-physical science, consider:
The world's most
famous equation:
E = mc**2
It is unique, precise, and beautifully compact.
E = mc**2
It is unique, precise, and beautifully compact.
The GenIQ
Model Version # 2 (Tree Display)

The
GenIQ Model Version #2 (Computer
Program)
x1 = PERCENT_FAT;
x1 = Int(x1);
x2 = AGE;
x3 = PERCENT_FAT;
x3 = Int(x3);
x4 = .1407257;
x5 = AGE;
x4 = x4 * x5;
x4 = Int(x4);
x3 = x3 * x4;
If x2 NE 0 Then x2 = x3 / x2; Else x2 = 1;
x1 = x2 - x1;
GenIQvar = x1;
Table7. GenIQ Model Version #2 GenIQvar2 Rank-order Prediction of MALE

IX.Summary
The machine learning paradigm (MLP) “let the data suggest the model” is a practical alternative to the statistical paradigm “fit the data to the equation,” which has its roots when data were only “small.” It was – and still is – reasonable to fit small data in a rigid parametric, assumption-filled model. However, the current information (big data) in, say, cyberspace requires a paradigm shift. MLP is a utile approach for database modeling when dealing with big data, as big data can be difficult to fit in a specified model. Thus, MLP can function alongside the regnant statistical approach when the data – big or small – simply do not “fit.” As demonstrated with the “Phat Example” data, MLP works well within small data settings.
For an eye-opening preview of the 9-step modeling process of GenIQ, click here.
Go to Articles page.